
Telegram is not built like Instagram, YouTube, or TikTok. There is no public dashboard with every audience segment, watch time curve, demographic layer, and conversion path. Telegram is more private, more direct, and often more fragmented from a measurement point of view.
That does not mean Telegram analytics is weak. It means you need to read it differently.
For a channel owner, Telegram statistics can answer practical questions:
- Are subscribers actually reading new posts, or is the audience becoming passive?
- Which posts spread through forwards and shares?
- What sources bring new followers?
- When is the audience most active?
- Which languages dominate the subscriber base?
- Did a paid campaign bring readers or only temporary joins?
- Are users keeping notifications enabled, or is the channel becoming easier to ignore?
But Telegram analytics cannot fully explain user intent, sales quality, private sharing, or the complete path from first view to purchase. If someone reads a post, sends it to a friend in a private chat, and later buys through a website, Telegram may show only part of that journey.
Telegram can show behavior inside the app. Business attribution has to be connected through tracked links, invite links, bot events, promo codes, CRM data, website analytics, or sales data.
What Statistics Are Available in Telegram by Default
Telegram gives admins different data depending on format, size, permissions, app version, and current product logic. Native statistics are available for channels and large groups that meet Telegram's current eligibility rules.
Telegram's public blog states that channels with more than 50 subscribers can view detailed statistics about growth and post performance. Telegram has also introduced group stats for large groups, including activity and growth graphs. In practice, availability can still depend on group size, admin rights, app version, and Telegram's current product logic.
A regular channel owner should start with Telegram's own statistics before adding third-party tools. Native data is the closest view of what happened inside your own channel.
| Telegram statistic | What it shows | How to interpret it | Common mistake |
|---|---|---|---|
| Followers or subscribers | Total audience size and growth over time. | Useful for tracking acquisition, but only meaningful when compared with views and retention. | Treating subscriber count as the main success metric. |
| Views per post | How many times posts are viewed. | Shows content reach and audience attention. Compare similar posts, not random posts from different days. | Comparing a pinned promo post with a normal educational post. |
| Shares or forwards per post | How often users pass a post to others. | A strong signal of usefulness, novelty, emotion, or social value. | Assuming low reactions mean low value when forwards are high. |
| Reactions per post | Lightweight feedback from readers. | Helps compare tone, format, and topic resonance. | Reading reactions as deep engagement. |
| Enabled notifications | Share of users who have not disabled notifications for the channel. | A useful loyalty signal. If it drops, your content may feel too frequent, too noisy, or less relevant. | Ignoring notification trends while increasing posting frequency. |
| Top hours | When followers are most active. | Helps plan publishing windows and ad post timing. | Posting only at peak time without testing content quality. |
| Views by source | Where Telegram attributes post views, when source data is available. | Helps separate subscriber views, forwards, external links, profile views, search, or other sources. | Treating all views as views from loyal subscribers. |
| New followers by source | Where new subscribers come from. | Useful for evaluating campaigns, cross-promos, links, and discovery sources. | Looking only at joins without checking later views. |
| Languages | Main language settings of the audience. | Helps adapt content language, examples, offers, and posting time. | Assuming language equals country or buying power. |
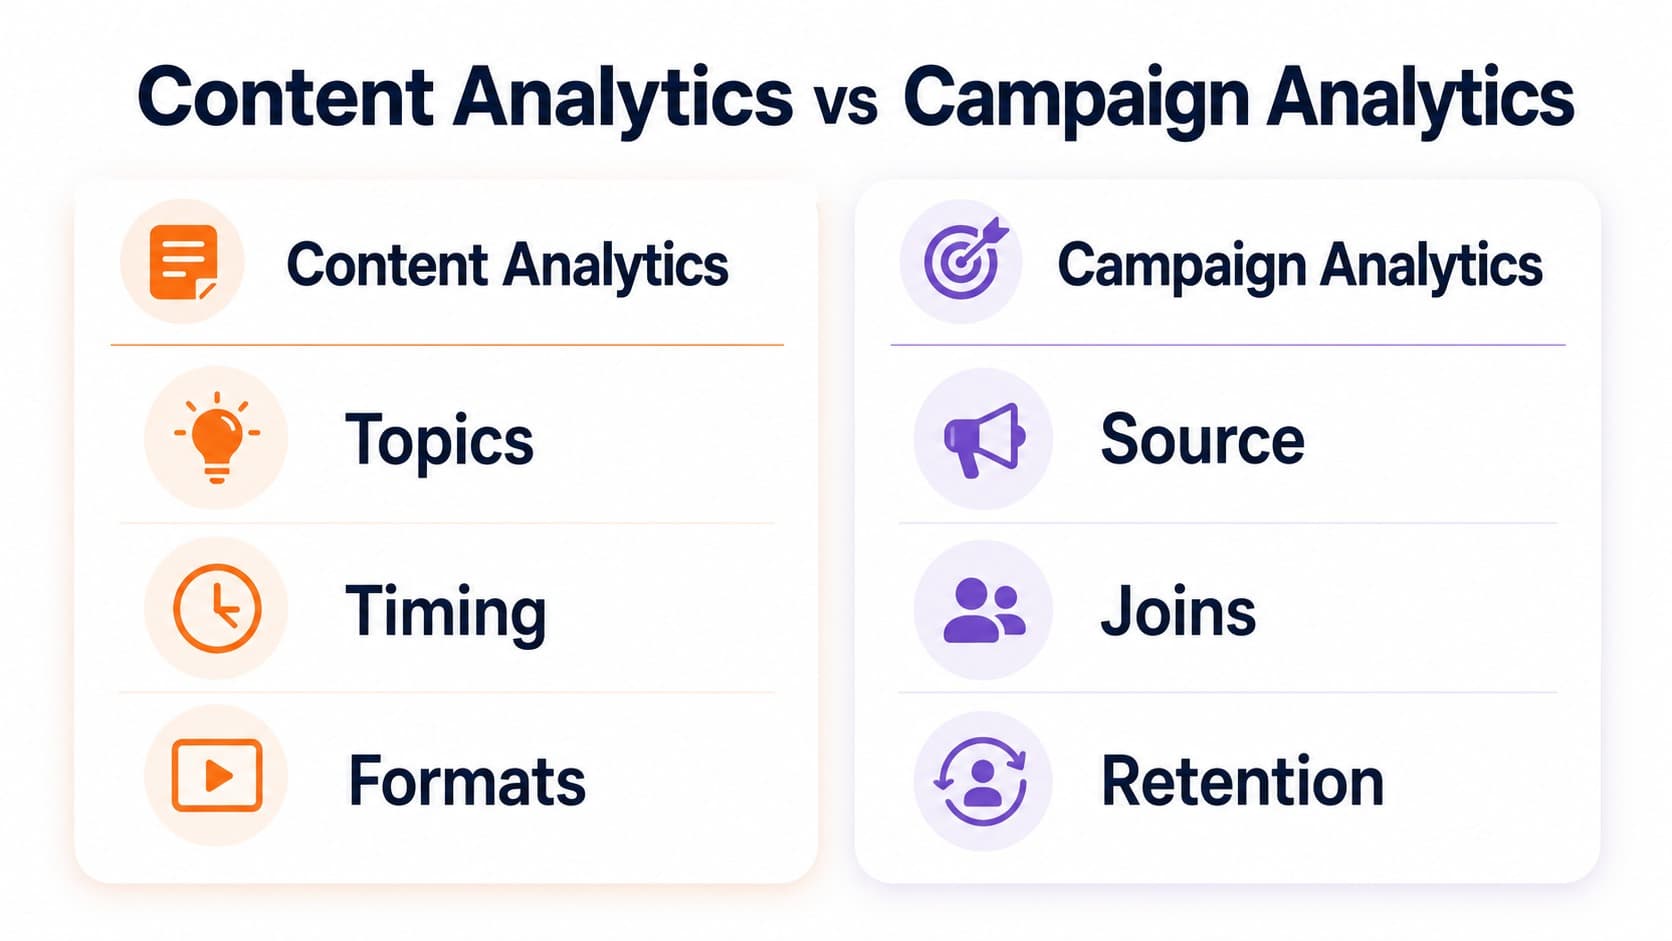
Content Analytics vs Campaign Analytics
Telegram analytics has two different jobs.
- Content analytics helps you understand what your audience reads, forwards, reacts to, and ignores. It is useful for choosing topics, formats, timing, posting frequency, and editorial style. For many content decisions, native Telegram statistics may be enough.
- Campaign analytics helps you understand whether a promotion source brings useful subscribers or customers. It needs tracking links, invite links, bot start parameters, promo codes, CRM data, website analytics, or sales data. This becomes important when you buy placements, run cross-promos, promote a bot, or use Telegram as part of a sales funnel.
Do not mix these two jobs. A post can be editorially strong but commercially weak. A campaign can bring many joins but poor long-term readers. The right metric depends on the decision you are making.
A small Telegram channel does not need a complicated analytics stack on day one. Start with native Telegram statistics: views, forwards, reactions, sources, subscriber growth, languages, and enabled notifications. Add more tracking only when the decision requires it. The rule is simple: do not track a metric unless it can change your next decision.
For a comparison of tools that extend native Telegram statistics, see: Best Telegram Analytics Tools
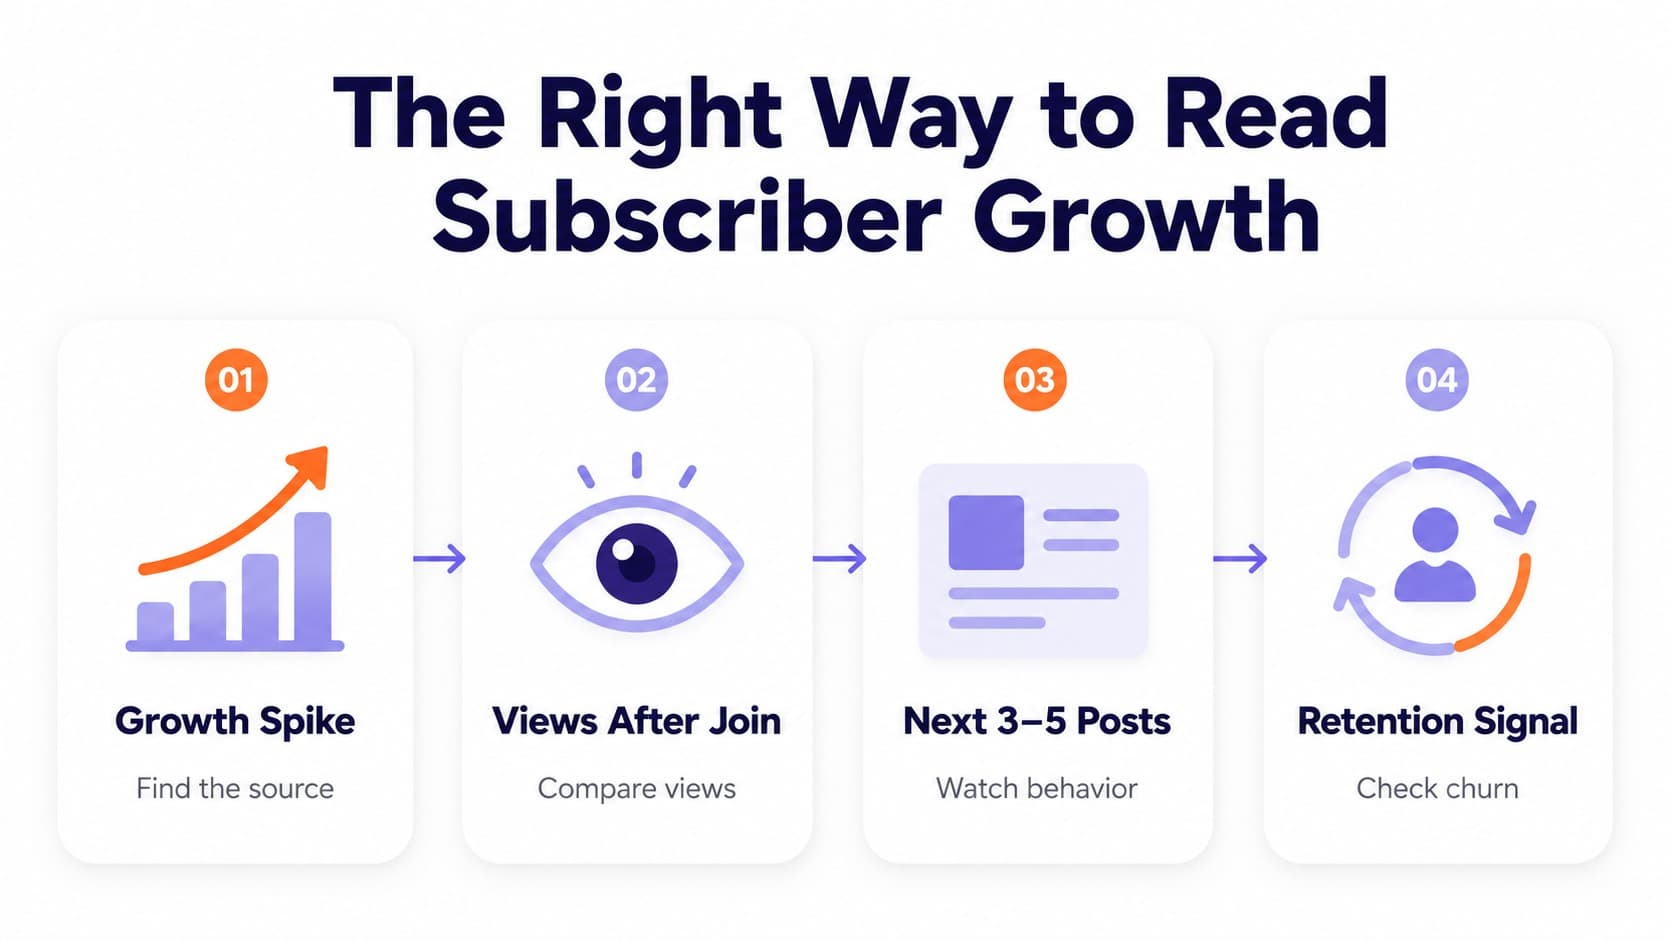
The Right Way to Read Subscriber Growth
Subscriber growth is the easiest metric to celebrate and one of the easiest to misunderstand.
A channel can grow and become weaker at the same time. This happens when new subscribers do not read posts, disable notifications, or leave after the first few days. A sudden jump in followers is useful only if later posts keep a healthy view rate.
A better question is not "How many people joined?" but "What did they do after joining?"
Use this sequence:
- Check the growth spike. Identify when the audience increased and which source caused it.
- Compare views before and after the spike. If views barely move, the new audience is weak.
- Watch the next 3-5 posts. Good traffic should lift or at least preserve average views.
- Check notification trends and unsubscribes. A weak source often creates churn within a few days.
- Compare cohorts by source. A smaller source that produces loyal readers may beat a larger source that produces passive joins.
Example: a fintech channel gets 1,800 new subscribers from a paid placement, but the next five posts still get the same average views as before. The campaign should not be scaled until the team checks the ad promise, welcome post, content match, and source quality.
View Rate Is the First Channel Health Metric
Views matter more when you compare them to subscriber count. A channel with 10,000 subscribers and 4,000 views per post is often stronger than a channel with 80,000 subscribers and 3,000 views per post.
A simple view rate formula: view rate = average post views / subscribers x 100
Use the average of several recent posts, not one post. Remove unusual outliers such as giveaways, scandals, pinned ads, or viral reposts.
| Situation | What it may mean | What to check next | Better action |
|---|---|---|---|
| Subscribers grow and view rate stays stable. | New audience is probably relevant. | Source quality, first-week behavior, content match. | Continue testing the same source carefully. |
| Subscribers grow and view rate drops. | Traffic may be broad, passive, or poorly onboarded. | Welcome post, ad promise, source fit, notification trend. | Pause scaling and fix onboarding. |
| Subscribers are flat but views increase. | Existing audiences are more active or posts are being forwarded. | Forward sources, topic, post format. | Turn the post into a repeatable format. |
| Views spike but subscribers do not. | Post reached outsiders but did not convert them. | CTA, channel bio, pinned post, invite path. | Improve the join path. |
| Views decline while posting frequency rises. | Audience may be tired or ignoring the channel. | Enabled notifications, promo density, topic mix. | Reduce low-value posts and test stronger formats. |
A falling view rate is not always a disaster. During fast growth, view rate can drop temporarily because new subscribers need time to build a reading habit. The warning sign is a sharp drop that continues after several posts and does not recover.
AdTech Strategist at MangoAds.
How to Interpret Views by Source
The source graph is one of the most useful parts of Telegram analytics because it tells you where attention comes from.
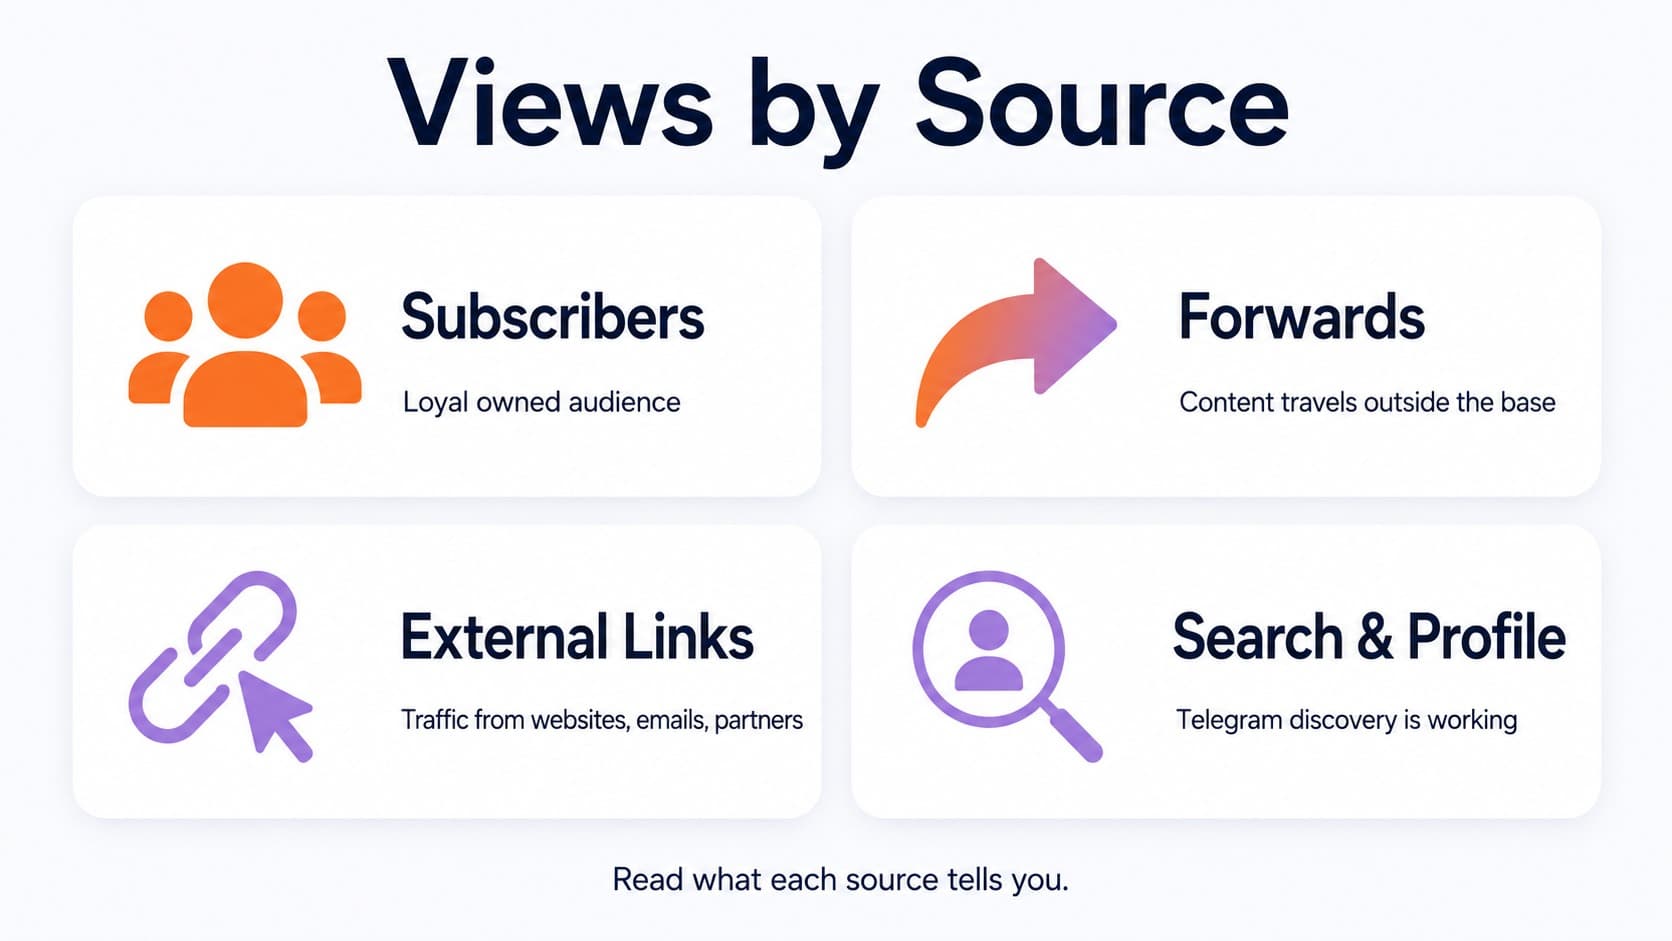
If most views come from subscribers, the channel has a stable owned audience. If many views come from forwards, the content travels outside the existing base. If external links drive views, website pages, social profiles, newsletters, or partner posts may be working. If profile views or search sources rise, discovery inside Telegram may be contributing.
The goal is not to make one source dominate. The goal is to understand the role of each source.
A healthy media channel may rely heavily on forwards. A private expert channel may rely more on loyal subscriber views. A brand channel may get strong external traffic after email campaigns or product launches. A campaign-driven channel may see source spikes from paid placements.
Example: a news channel publishes a short explainer on a breaking regulation update. Subscriber views are normal, but forward-driven views are three times higher than usual. That means the post solved a sharing need. The team should not only celebrate the spike. It should analyze the structure: headline, length, timing, source links, and format. The next move is to create more explainers that make complex updates easy to forward.
Forwards Are Stronger Than Reactions
Reactions are useful, but forwards often tell you more about value. A reaction says, "I noticed this." A forward says, "Someone else should see this."
Posts that get forwarded usually have one of these qualities:
- They explain something complicated in a simple way.
- They save time, money, or effort.
- They contain news, warnings, checklists, templates, or useful examples.
- They help the reader look informed when sharing with someone else.
- They are specific enough to be useful outside the original channel.
Do not judge every post by the same engagement type. A funny post may get reactions. A serious checklist may get forwards. A product update may get clicks. A poll may get responses. A case study may get saves, comments, or direct messages, even if reactions look modest.
Top Hours Show Opportunity, Not a Guarantee
Top hours help you find when followers are active, but they do not choose the best publishing time for you automatically.
If every channel posts at the same peak hour, competition for attention rises. Sometimes a slightly earlier post performs better because it reaches users before the feed becomes crowded. Sometimes a later post works because people have time to read longer content.
Use top hours as a testing map:
- Pick two strong time windows from the graph.
- Publish similar formats in both windows for two weeks.
- Compare views after the same time period, such as 2 hours, 12 hours, and 24 hours.
- Separate weekdays from weekends.
- Watch forwards, not only views.
Example: an education channel sees peak activity at 8 PM. The team posts long tutorials at 8 PM and short templates at 12 PM. After two weeks, the long tutorials perform better in the evening, but templates get more forwards at lunchtime. The conclusion is not "8 PM is best." The real conclusion is that different formats need different timing.
Language Data Can Reveal Content Mismatch
Telegram's language graph can be useful, but it should be read carefully. It usually reflects user language settings, not a full demographic profile.
Still, language data can explain weak performance. If an English-language channel suddenly attracts a large non-English segment from a paid campaign, views may rise for the first post and then fall quickly. The audience may understand the ad but not want daily content in English. The same can happen when a channel targets global users but uses examples, prices, events, or cultural references from one market only.
Use language data to check:
- Whether your content language matches the audience.
- Whether paid traffic came from the expected region.
- Whether examples and offers are too local.
- Whether you need separate channels, separate posts, or clearer positioning.
Do not over-personalize content based only on Telegram language data. It is a signal, not a full user profile. Use it with source data, campaign data, comments, clicks, and business results.
Sara Al MansooriAdTech Strategist at MangoAds.
Reactions Show Tone Fit
Reactions are not just a vanity metric. They help you understand tone.
If useful posts get views but no reactions, the audience may read silently. That is common in finance, B2B, legal, healthcare, cybersecurity, and professional topics.
If entertainment posts get strong reactions but weak clicks, they may be good for retention but weak for conversion. If critical posts get angry reactions but many forwards, the topic may be controversial but valuable.
Do not optimize only for positive reactions. Sometimes the most important post creates questions, disagreement, or discussion. For a brand, that can still be useful if the discussion is relevant and controlled.
Campaign Analytics for Paid Telegram Promotion
When you buy a placement, native Telegram statistics help you verify what happened after the ad went live. But you need a tracking plan before the campaign starts.
At minimum, prepare:
- A unique invite link for each channel, campaign, or partner.
- UTM parameters if traffic goes to a website.
- A separate bot start parameter if the campaign sends users to a bot.
- A simple spreadsheet with spend, placement time, subscribers joined, clicks, first-week views, and churn.
- Screenshots or reports from the publisher after the placement period.
Do not evaluate a paid campaign only by day-one joins. A cheap subscriber is not cheap if they never read again.
For a practical workflow on choosing ad-ready communities before testing, see: How to Find Telegram Channels and Groups for Advertising
How to Evaluate a Sponsored Post After 24 Hours
The first 24 hours after a sponsored post are useful, but they are not the whole story.
| Layer | Metric | What good looks like | What weak looks like |
|---|---|---|---|
| Delivery | Post views or impressions. | Placement reached the expected audience size. | Views are far below normal channel averages. |
| Attention | CTR, reactions, forwards. | Users noticed the post and took some action. | Views exist, but there are almost no clicks or signals. |
| Join quality | New subscribers from unique invite links. | New users join and read later posts. | Users join, then ignore or leave. |
| Retention | 7-day and 30-day behavior. | New cohort keeps reading. | Sharp churn after the first day. |
| Business result | Bot starts, leads, sales, demo requests, purchases. | Cost per useful action is acceptable. | Campaign creates activity but no business outcome. |
| Learning value | Clear next test. | You know what to repeat or change. | Data is too messy to explain the result. |
Example: a SaaS company buys a post in a productivity channel. The ad gets 900 clicks and only 70 joins. At first glance, the join rate looks weak. But 18 users start a trial through the landing page. For this campaign, channel joins were not the main goal. The correct metric is cost per trial, not cost per subscriber.
Group Analytics Need Different Logic
Groups should not be measured like channels. A group may have fewer clean views, but it can create trust, support, feedback, and objections that never appear in channel statistics.
For a clearer breakdown of when each format works best, see: Telegram Group vs Channel
For groups, useful metrics include:
- Active members over time.
- Number of meaningful questions.
- Admin response time.
- Recurring topics.
- Spam rate and moderation load.
- Number of support issues solved publicly.
- Poll participation.
- Product feedback.
- Leads, trials, renewals, or purchases influenced by discussion.
Poll participation is especially useful when you track it over time. After a poll receives 100 votes, Telegram can show how voting changes, which helps community managers test demand, compare content ideas, collect feedback, and understand whether members prefer one format, product feature, or topic over another.
A group with 500 members and 60 useful weekly messages can be more valuable than a group with 20,000 members full of spam, one-word replies, and low-quality promotion.
Example: a course creator runs a private student group. Message volume is not high, but students ask detailed questions, share progress, and answer each other. The group is healthy because it supports retention and completion.
A Simple Weekly Telegram Analytics Routine
You do not need to check every graph every day. For most channel owners, a weekly routine is enough.
- Review growth and source graphs. Identify where new followers came from and whether the source was expected.
- Compare the last 5-10 posts. Look at views, forwards, reactions, and clicks by format.
- Check view rate. If subscribers grew, confirm that post views also moved in a healthy direction.
- Watch the enabled notifications metric and unsubscribe patterns. If notification rate drops after certain formats, reduce noise.
- Log campaign results. Record source, spend, joins, clicks, 7-day views, and churn.
- Pick one action for next week. Change timing, format, CTA, source, or posting frequency.
The key is consistency. Telegram analytics becomes useful when you compare the same metrics over time.
What to Track by Channel Stage
A new channel and a mature channel should not use the same KPI priority.
| Channel stage | Main goal | Primary metrics | What to avoid |
|---|---|---|---|
| 0-500 subscribers | Validate topic and format. | Repeat views, early forwards, replies, poll responses. | Buying traffic before the channel has repeatable content. |
| 500-2,000 subscribers | Build a reading habit. | View rate, best formats, posting time, source quality. | Changing topics and formats too often to read the data. |
| 2,000-10,000 subscribers | Improve growth quality. | New followers by source, 7-day retention, churn after promotions. | Scaling paid sources based only on day-one joins. |
| 10,000-50,000 subscribers | Balance growth and monetization. | Average views, forwards, clicks, ad performance, notification trends. | Increasing ad density until attention drops. |
| 50,000+ subscribers | Protect long-term audience value. | Segment behavior, revenue per post, campaign history, audience stability. | Using old averages when recent audience behavior has changed. |
What to Do When a Metric Drops
A drop in one metric does not always mean the channel is failing. It means you need to diagnose the cause.
| Metric drops | Possible cause | First check | Better response |
|---|---|---|---|
| View rate | New traffic is too broad or content is weaker. | Compare views before and after each source. | Pause scaling and review source quality. |
| Forwards | Posts became less useful or less shareable. | Compare topic, format, and headline style. | Create more checklists, explainers, templates, or summaries. |
| Reactions | Tone no longer fits the audience. | Compare positive, negative, and neutral reactions. | Adjust tone without chasing emoji engagement. |
| Clicks | CTA is weak or offer is unclear. | Check link placement and promise. | Test one clear CTA per post. |
| Enabled notifications | Posting frequency may feel too noisy. | Check frequency, promo density, and content mix. | Reduce low-value posts and protect stronger formats. |
| Joins from paid traffic | Creative or audience fit is weak. | Compare ad promises with channel content. | Rewrite the ad and tighten targeting. |
Common Mistakes in Telegram Analytics
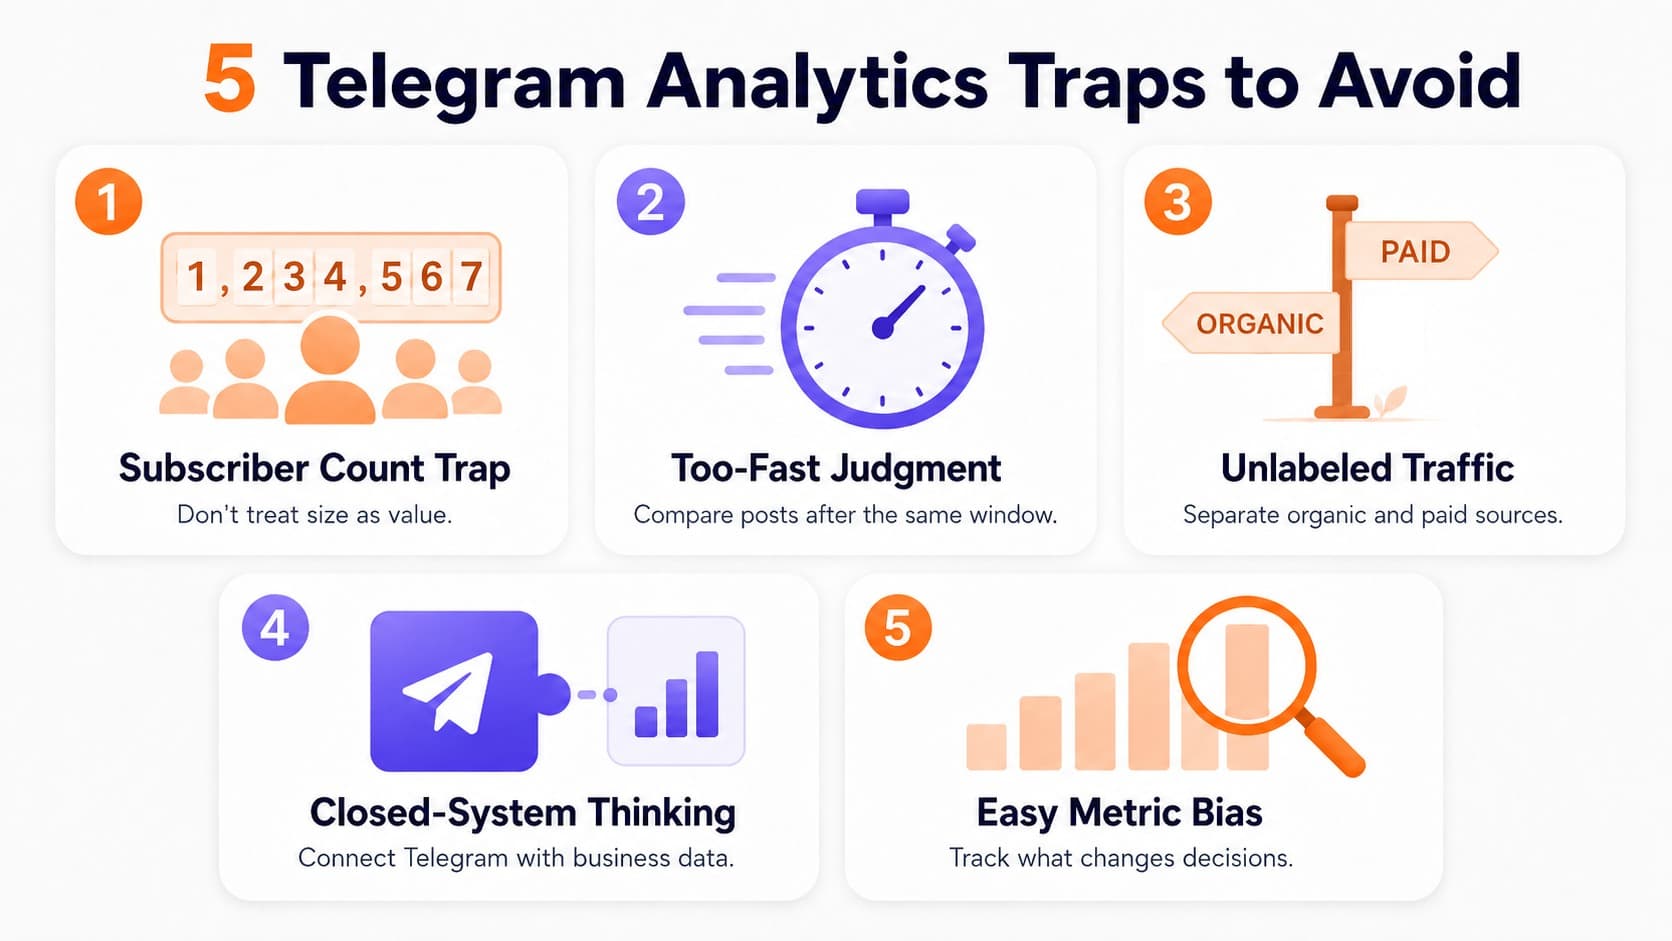
Do not use subscriber count as a shortcut for channel value. It hides attention quality, retention, and source fit.
The second mistake is judging posts too quickly. Some posts spread slowly through forwards. Others get most views in the first hour and then stop. Compare posts after the same time window.
The third mistake is mixing organic and paid traffic without labels. If you do not use unique links, you will not know which source produced loyal readers.
The fourth mistake is treating Telegram as a closed system. Telegram stats should be connected with website analytics, bot starts, CRM records, promo codes, payment data, or sales calls when business results matter.
The fifth mistake is optimizing for the easiest metric instead of the useful one. A post with modest reactions can still produce strong clicks. A campaign with cheap joins can still bring poor readers. A group with low message volume can still reduce support workload.